How I Use Hermes for Stock Screening and Analysis
I built a two-sleeve stock research system inside Hermes: dividend compounders and S-curve growth. That enforces the discipline I know I need.
I invest in two kinds of companies. They need different frameworks.
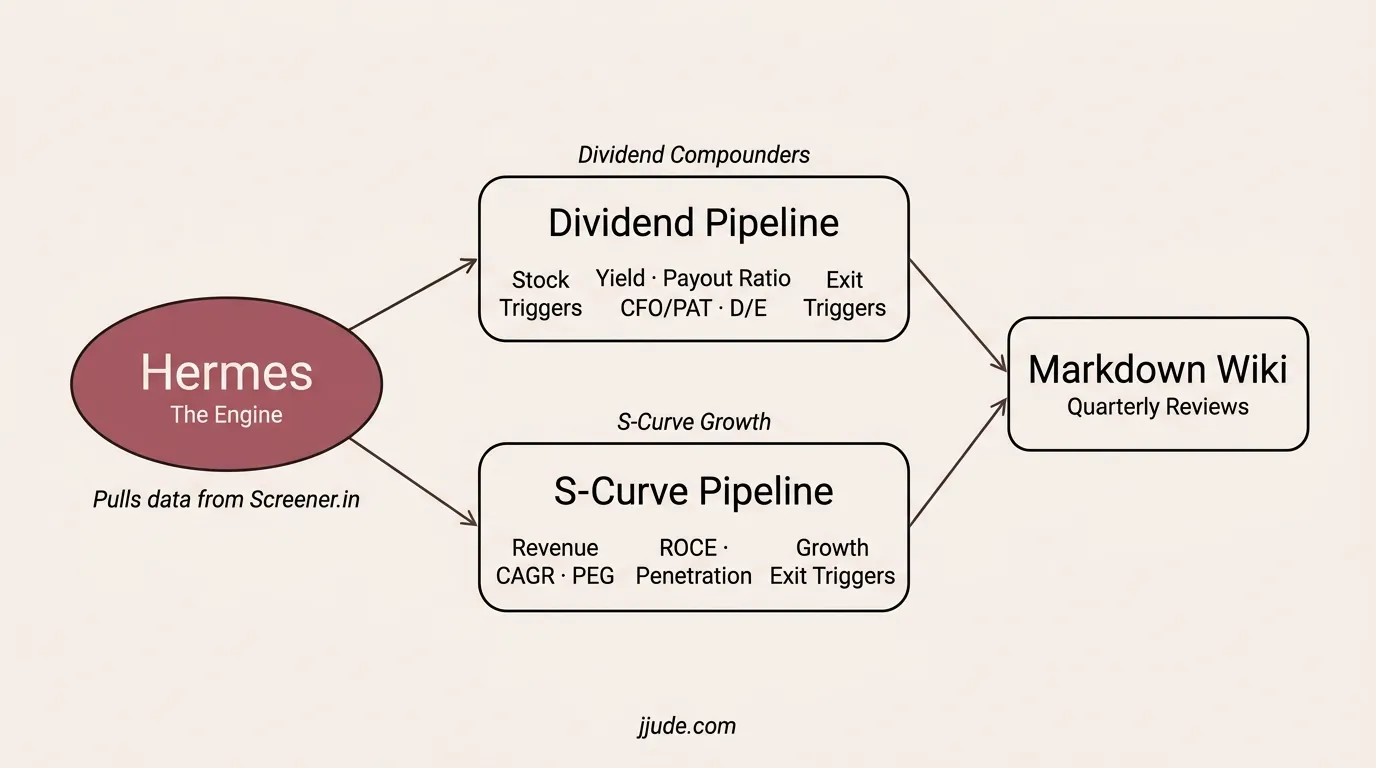
Dividend compounders. The goal is capital preservation plus steady income. I want the highest dividend payers, and I want quality companies that will keep paying year after year. In India, this has mostly meant PSUs. The government owns majority stakes and likes dividends. The business models are mature and predictable. The moats come from scale and regulation, not innovation.
S-curve growth. The goal is multi-year compounding from structural shifts. A new industry emerges. Adoption starts slow. Then it accelerates. The market keeps pricing it as a 3-year cycle, but the real runway is 10 to 15 years. That gap, between how long the market thinks growth lasts and how long it actually lasts, is the S-curve opportunity.
The evaluation changes completely between these sleeves. A dividend stock gets judged on payout ratio and earnings stability. An S-curve stock gets judged on revenue CAGR, market penetration, and operating leverage. I can't use the same lens.
Hermes runs the same pipeline against both: pull data from Screener.in, analyze against the framework, write the result to my markdown wiki. Same tool, different lens depending on which sleeve I'm evaluating.
# The Dividend Pipeline
I might run a very simple screen on screener.in like this:
Dividend yield > 4
or even like this:
Return over 5years > 15 AND
Debt to equity < 1 AND
Average return on equity 5Years > 15 AND
PEG Ratio < 1 AND
PEG Ratio > 0 AND
Price to Earning < 16 AND
EPS growth 5Years > Historical PE 5Years AND
Promoter holding > 50
I have a whole bunch of screens like this already stored, which I've been using for a long time to identify quality stocks. Though Hermes can also run screens, I've not yet started using it for that purpose.
From the list of stocks, I will give an instruction like this:
I want regular dividends; but also don't want to lose my principal

stock | price | DY
coal india | 414 | 5.13
BPCL | 320 | 5.47
WIPRO | 184 | 5.99
IOCL | 140 | 4.99
GAIL | 181 | 4.13

I will not buy all these stocks;
wipro - IT stocks; now they are facing pressure because of AI; but I'm sure indian IT companies will figure out a way; maybe i can keep it for a year and check; if it doesn't go well, then I can sell it

from BPCL, IOCL, GAIL will buy one; since they are all in the same domain; of all these, I like BPCL - since the dividend yield is more; but IOCL is the cheapest and it is largest in market cap too; so that is attractive

coal - I like it because a regular dividend company; recently PPFAS bought shares of the company; and the fossil will continue to energize the world; it is not going down anytime soon.
So I'm starting with a certain context, giving my reasonings. This is a starting point. Hermes navigates to Screener.in, pulls the consolidated financials: P&L, balance sheet, cash flow, ratios, shareholding pattern. It runs a script that picks P/E, PEG, P/B, CFO/PAT, D/E, and normalized dividend yield. It populates a structured analysis template. It classifies the stock into a strategy bucket.
## Quick Evaluations

### Coal India (2026-08-02)
- Price: ₹414, DY: 5.13%
- Quick thesis: Consistent dividend payer, PPFAS bought in, coal demand persists
- Key concern: Zero pricing power: govt sets coal prices, upside capped
- Verdict: Buy. Revisit if dividend payout ratio crosses 80%

### BPCL (2026-08-02)
- Price: ₹320, DY: 5.47%, P/E: 8.95
- Quick thesis: Best ROCE among OMC peers (25.7%), strong CFO coverage
- Key concern: Just posted a loss quarter: GRM cycle risk
- Verdict: Top pick among OMCs. → [Full analysis](bpcl.md)

### IOCL (2026-08-02)
- Price: ₹140, DY: 4.99%
- Quick thesis: Cheapest on P/E, largest market cap, "too big to fail"
- Open question: Is cheap = bargain, or cheap = lower quality?
- Need to check: P/B ratio, ROCE trend, dividend payout ratio vs BPCL
- Verdict: Deeper analysis needed before deciding

### GAIL (2026-08-02)
- Price: ₹181, DY: 4.13%
- Quick thesis: Regulated gas transmission, structurally less volatile than OMCs
- Energy transition angle: If India electrifies fast (EV push), gas demand rises as bridge fuel for power generation. Oil demand from petrol/diesel gets displaced.
  → GAIL gains, BPCL/IOCL lose. This is a 5-10 year tailwind.
- Verdict: Deeper analysis needed. Compare payout ratio and D/E with BPCL.
Worth noting: BPCL came out as the clean "top pick" here, and BPCL is also the stock I said I liked most in my own reasoning. I can't fully rule out that Hermes picked up on my stated preference and reflected it back rather than arriving at it independently. I don't have a clean way to test for that yet, but it's the kind of bias the whole point of this system is supposed to guard against, so I'm flagging it rather than pretending the verdict is purely objective.
Since I'm going to do this often, I ask it to create a skill as well as a watchlist. Concretely, that means Hermes saves this instruction pattern: the reasoning format, the table structure, the template it fills in, as a reusable prompt it can call on its own next time, and adds the stocks to a tracked watchlist file in the wiki. This is how the repeated routine tasks become intelligent. I don't have to repeat the same instructions again and again. Next time, I can just say,
evaluate gail for dividends
and it will do the same without me explaining all the reasons.
What I liked in the above analysis is:
Energy transition angle: If India electrifies fast (EV push), gas demand rises as bridge fuel for power generation. Oil demand from petrol/diesel gets displaced.
That's an angle I didn't consider. So Hermes didn't just analyse the numbers. It constructed a narrative. Much like an analyst. To be honest, though this narrative makes sense, I don't know if this is a narrative that could be true or is it hallucination. Yet, I was surprised by this comment.
Even if it is a hallucination, I have a point that I can double-click and conduct further analysis.
After this, I asked the agent to conduct a detailed analysis for BPCL, same pipeline, deeper pass. It also does technical analysis when I ask. It pulls DMA (both 50 & 200) overlays from Screener.in charts, saves screenshots, and appends dated snapshots to each stock file. Over time, I can scroll through the history and see DMA crossovers, volume patterns, and price levels at each review point. The data compounds.
The Screener.in pipeline isn't bulletproof. It breaks when they change page markup, and I fix it when it does. The maintenance cost is real, but small relative to what the system produces.
When Hermes does multiple analyses at the same time, it drops essential details. So I batch the analysis and ask it to analyse stocks one by one, asynchronously. There are two options:
- Since I use Slack to interact with Hermes, I schedule messages in Slack. Send messages every hour. This is what I usually prefer.
- If the list is long, then I ask Hermes to create a cron job with a progress list (by creating
stockevals.md) and conduct analysis one by one, marking progress as it goes.
# The S-Curve Framework
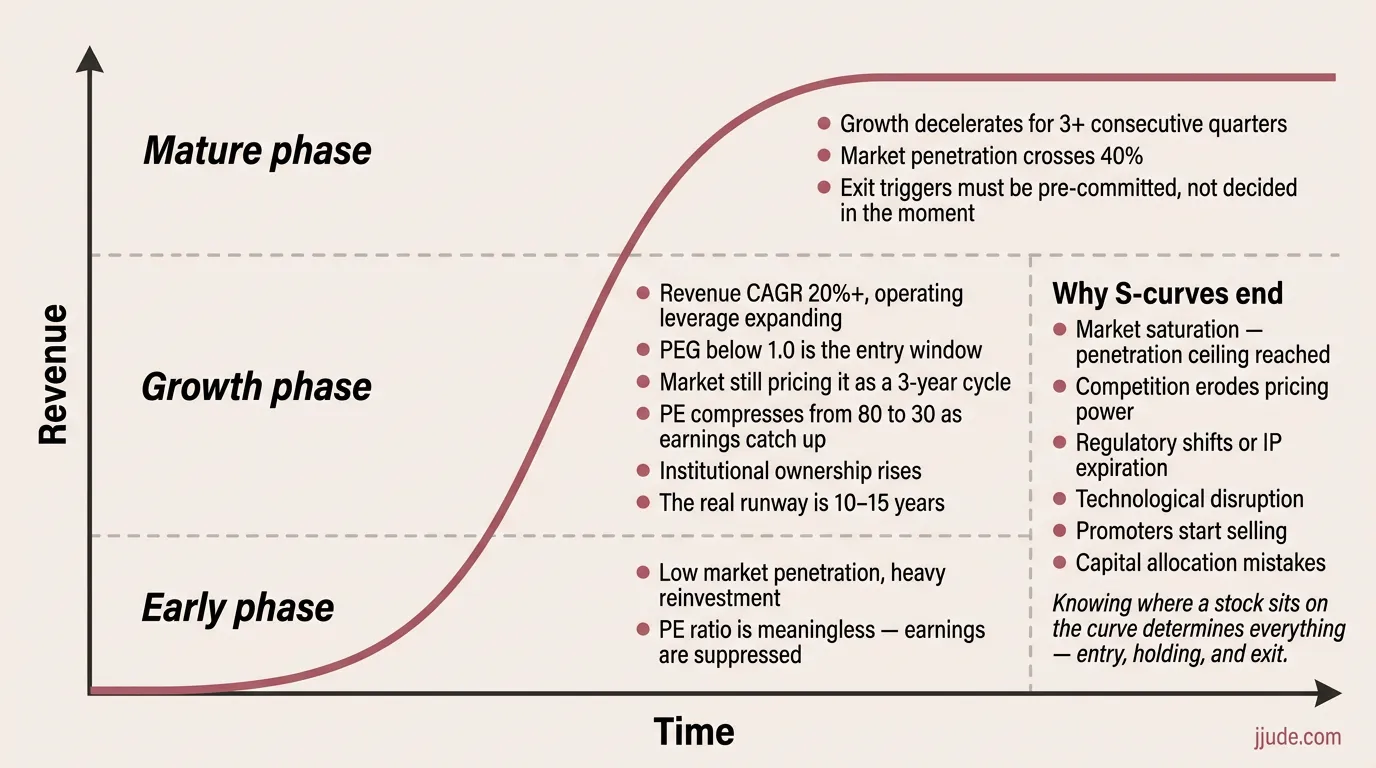
The S-curve framework started with a question: if I'm going to allocate a portion of my portfolio to growth, what framework do I use?
I started with this question to Hermes:
Are there any Indian comapnies in stock market that are at the early part of s curve that I can invest? How shud I evaluate these comapnies - only PE?
It came up with the definition first:
An S-curve has three phases:
- **Bottom flat (0-10% penetration):** Early adopters, unproven unit economics, high failure rate. You need conviction on the _inevitability_ of adoption, not just growth.
- **Steep middle (10-40% penetration):** The sweet spot. Growth is visible in the numbers, competitive moats are forming, but the market hasn't fully priced the trajectory yet. This is where you want to enter.
- **Top flat (40%+):** Growth decelerates. The stock might still compound but it's no longer an S-curve play; it's a quality compounder or dividend stock.
Early S-curve = penetration below ~15%, with 3+ years of 20%+ revenue growth ahead.
I notice the definition says both "steep middle starts at 10%" and "early S-curve is below 15%". There's overlap there. The framework is approximate, so I'm leaving it as-is.
and then listed parameters by which I can evaluate.
- Revenue growth quality. Is the 3-5 year CAGR above 20%? Is it accelerating or decelerating?
- Market penetration. What percentage of the total addressable market has been captured? Below 15% means long runway.
- Operating leverage. Is OPM expanding as revenue scales? High fixed cost base means powerful earnings growth when revenue crosses breakeven.
- PEG ratio. PE divided by earnings growth rate. Below 1.0 means mispriced growth. Above 2.0 means the market has already priced the S-curve.
- Earnings quality. CFO/PAT above 0.8. Receivables not ballooning. Earnings backed by cash, not accounting.
- Capital allocation. ROCE trend, debt levels, promoter pledge, equity dilution. Growth companies die by bad capital allocation, not bad products.
- Smart money signal. Are promoters, FIIs, and DIIs buying or selling? Rising institutional ownership confirms the thesis.
Each criterion gets a weight and a score out of 10. The total tells me whether to deep dive, watch, or pass.
The framework also has its own exit triggers, fundamentally different from dividend stocks. I don't exit because "PE looks expensive." I exit when revenue growth decelerates for three consecutive quarters. Or sector penetration crosses 40%. Or promoters start selling. The exit signal is growth deceleration, not valuation.
# Screening Sectors with Hermes
Once I had the parameters, the next step is to look for sectors that could have s-curve growth. It came up with these sectors:
Aerospace and Defense. Nine companies screened. Data Patterns came out as the strongest S-curve candidate: 33% revenue CAGR, 21.9% ROCE, genuine early-stage defense electronics play. HAL and BEL are excellent companies but mature, 7 to 8% revenue growth. Wrong strategy bucket.
EMS / Electronics Manufacturing. India's share of global EMS is roughly 4%. Six companies screened. Dixon is the leader but the standalone data is misleading, deferred pending consolidated review. Amber and Kaynes under deeper analysis. The sector thesis is strong even if individual picks need more work.
Financialization / AMC. India's mutual fund AUM-to-GDP ratio is roughly 17% versus the global average of roughly 75%. Seven companies screened. Nippon Life India AMC emerged as the top S-curve pick: 25% revenue CAGR, 44% ROCE, 69% OPM. The exit trigger I wrote for Nippon: "If AUM growth drops below 15% for two consecutive quarters, or if the AUM-to-GDP ratio crosses 45%, reassess the S-curve thesis." HDFC AMC is a quality compounder, not an S-curve.
Data Centers. India has roughly 1 GW of data center capacity versus the US's 18 GW. But there are no pure-play listed DC companies in India. Netweb Technologies, an HPC server manufacturer, is the closest proxy with 73% revenue CAGR but caveats around customer concentration. Watching, not diving.
Healthcare. Hospital chains have genuine capacity-driven S-curves but are capital-heavy. Not explosive growth stories. Deferred for now.
EV Ecosystem. Hunting ground identified. Penetration is roughly 2% for 4-wheelers. Battery manufacturing and charging infra are at less than 5% penetration. Pending screening.
Each sector has its own domain watchlist in my wiki. Each company gets a verdict: DEEP DIVE, WATCH, CAUTION, NOT S-CURVE, or PASS. The ones marked DEEP DIVE then go through the full analysis template.
This is what I got after back and forth in analysis. Honestly, I didn't even know some of these stocks. It did flag that GRSE is not an aerospace stock.
# Aerospace & Defense: Deep Dive Table
| Rank | Company | Verdict | Key Data |
|---|---|---|---|
| 🟢 | Data Patterns | Deep Dive | 35% PAT CAGR, 40% OPM, no debt, stable promoter, <1% penetration of defense electronics TAM. PE 91 is rich but growth justifies attention. |
| 🟡 | GRSE | Watch | PE 37 (cheapest in sector), 43% ROCE, 39% sales growth. Shipbuilding cycle play. |
| 🟡 | MTAR | Watch (concerns) | TTM inflection +53% interesting, but promoters sold 20%+ stake and PE is 157. |
| 🔴 | Zen Technologies | CAUTION | Post-S-curve deceleration. Revenue -24% TTM but still trading at PE 86. Classic trap. |
A numerate reader will notice the PEG tension here. Data Patterns has PE 91 against 35% PAT CAGR. That's PEG ~2.6, above my own threshold of 2.0 for "market has priced the S-curve." Meanwhile GRSE (PE 37, 39% growth → PEG ~1.0) fits the mispriced-growth criterion better but only got Watch. The PEG ratio is one of seven criteria, not the whole framework. Data Patterns scored higher on operating leverage, earnings quality, and market penetration. That said, the table in its current form doesn't show those trade-offs. I'm flagging this the same way I flagged the BPCL bias: silence would read as the framework not being applied consistently.
I have such analysis and verdict for all sectors.
# Why This Matters
The real value isn't the specific companies that come out of the screen. It's the discipline.
The first benefit is time. I'm a working CTO homeschooling kids. I don't have hours to research every company in a sector I'm screening. Half the time I don't even know the companies exist. Hermes pulls the numbers and runs the initial analysis. I bring judgment. When something isn't clear, a market size figure, a definition, a ratio that looks off, I chat with the analysis itself. That back-and-forth is thinking aloud, and it clears a lot of mental fog I'd otherwise carry around unresolved.
The second is structure. Everything now lands in structured folders instead of scattered notes. I've tracked investments for years, but the notes were never uniform: different templates at different times. The one thing they had in common was plain text. That's enough. I can feed the whole corpus to an agent and ask it to find patterns, flag biases, surface what I've been missing. And the structure gets better as I go, not worse.
The third is portability. Everything sits locally in text files. I'm not tied to Claude, or ChatGPT, or even Hermes. If a better agent shows up tomorrow, I hand it the corpus and I'm running from minute one. The intelligence is rented. The data isn't.
I've been investing long enough to know my own weaknesses. Hermes doesn't solve them. But it reduces them. Every position has exit triggers in writing. Every watchlist candidate has entry gates. Every review has a schedule and a template. The system is boring and mechanical. That's exactly what makes it useful.
There's also the compounding effect. My wiki now has a growing collection of dated technical snapshots. A domain note written in August 2026 can be revisited in February 2027 with fresh quarterly data and a year's worth of chart history. The analysis builds on itself.
# What's Next
A few things I plan to add:
News curation for watchlist stocks. A cron job that pulls headlines for companies on my watchlist, filters out noise, and flags anything that might affect a thesis, before I read about it on a finance portal.
Finish the sector screens. EV ecosystem, Data Centers, Healthcare. Each sector I deferred is a gap in the thesis. The framework works. I just haven't applied it everywhere yet.
Quarterly review automation. When quarterly results drop, Hermes should pull the numbers, compare against the previous quarter, and flag deviations, without me having to remember to check.
The broader pattern is the same one I've described in earlier Hermes posts: the image generation pipeline, the LLM wiki: build systems on top of systems. Each pipeline becomes infrastructure for the next. The wiki grows. The analysis compounds.
This is not investment advice. I am not recommending any stock mentioned in this post. Do your own research.
Under: #wealth , #hermes , #tools , #aieconomy